
DISCLOSURE: This post may contain affiliate links, meaning when you click the links and make a purchase, we receive a commission. Also an Amazon Associate, I earn from qualifying purchases. DISCLAIMER: The information and opinions within this content are for information purposes only. Guidance is based on personal interpretations and in no way, represents legal or financial advice. For more information, read my disclosure policy.

Since few people talk about money, it can be hard to know where you stand compared to others. This post will take a look at some recommended budget category percentages and average spending in the United States.
What Should My Budget Category Percentages Be?
A question I hear a lot is, “How much should I be spending in each budget category?” This is a very personal question that no one can answer for you. The real question is probably, “Is my spending out of control compared to other people?” or “Am I saving enough?”
Dave Ramsey’s Budget Category Percentages
Let’s start by taking a look at what personal finance guru Dave Ramsey has to say on this topic. If you’re not familiar with him, he’s most famous for his book The Total Money Makeover and his Financial Peace University classes.

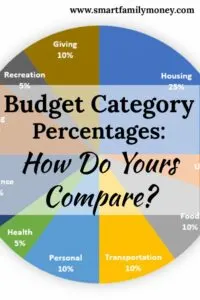
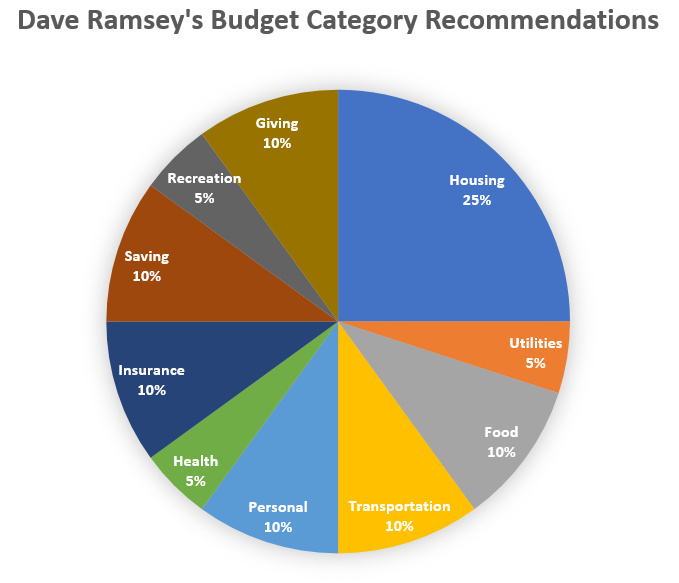
Here are his recommended budget category percentages, as listed on Every Dollar:
- Giving: 10-15%
- Housing: 25-35%
- Utilities: 5-10%
- Food: 10-15%
- Transportation: 10-15%
- Health: 5-10%
- Insurance: 10-25%
- Personal (including Clothing): 10-15%
- Recreation: 5-10%
- Saving: 10-15%
Many of these are pretty big ranges, leaving a lot of room for personalization. If you look at the lower end of all of these percentages, the chart would look like this:

National Average Budget Category Percentages
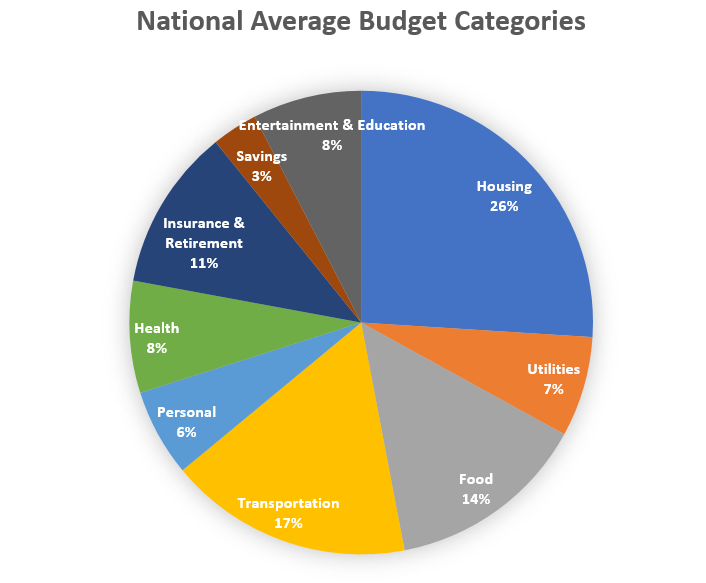
We looked at one “ideal” image of a budget, but what are people’s reality? We can’t really ask our friends and neighbors, but we can take a look at the statistics from the United States Bureau of Labor Statistics (BLS). They collect data on household income and spending and have recently released the data for 2015. Combining categories to be similar to the chart about, the average U.S. spending looks like this:
- Housing: 26%
- Utilities: 7%
- Food: 14%
- Transportation: 17%
- Personal (including clothing): 6%
- Health: 8%
- Insurance & Retirement: 11%
- Savings: 3%
- Entertainment & Education: 8%

Dave Ramsey Budget vs. Average American Budget
So what are the differences between Dave Ramsey’s ideal budget and the reality of American spending? If you compare the charts side-by-side, you’ll notice these big differences:
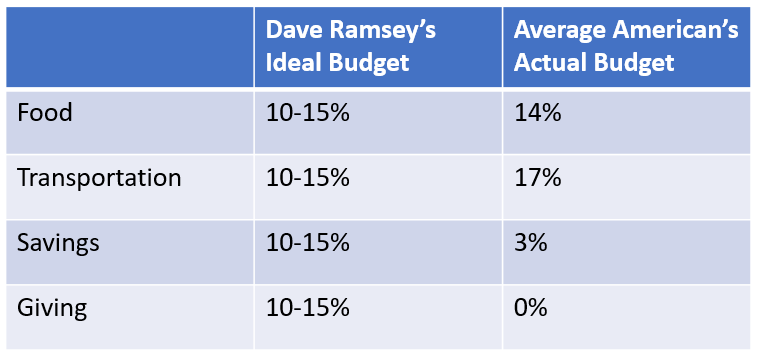

The food and transportation percentages are close to the upper end of Dave Ramsey’s ranges, but the whole pie still needs to add up to 100%. If you’re maxing out your food and transportation, you need to cut back somewhere (and often it’s savings that get cut).
Having talked to many people about their budgets, these charts make a lot of sense to me. Food expenses and cars are often what keep middle-class families from saving and giving as much as they’d like. Housing expenses can also be the problem, especially in high cost of living areas.

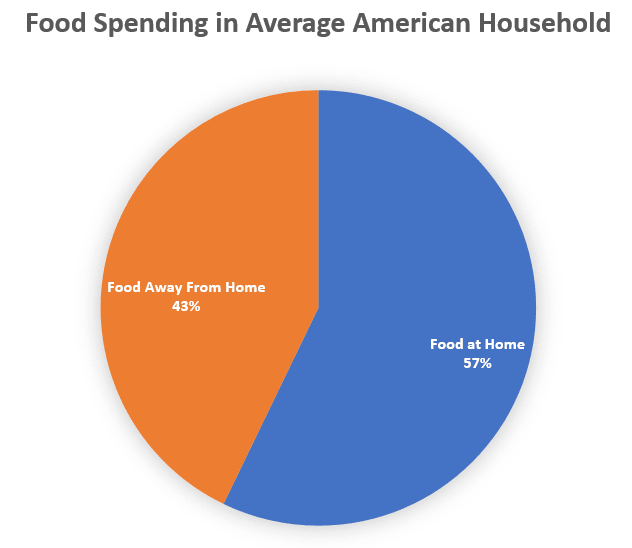
If you look a little closer at the numbers from the BLS, you’ll see the average family owned 1.9 cars and spent 43% of their food budget on restaurants. For those looking to change their budgets, this area definitely needs a closer look.

Elizabeth Warren’s 50/30/20 Budget Category Percentages
Dave Ramsey’s budget category percentages are very specific and might not fit your personal values and goals. Another popular budget category percentage recommendation is the 50/30/20 rule. It has been discussed by a number of personal finance experts but was made popular by Senator Elizabeth Warren in her book All Your Worth: The Ultimate Money Plan.

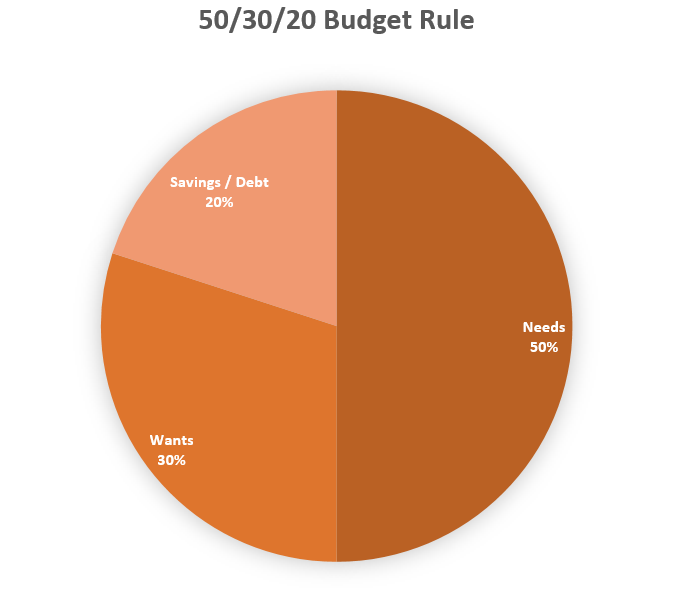
The 50/30/20 plan is a simple theory. Your budget should be divided like this:
- 50% Needs
- 30% Wants
- 20% Savings or Debt Payoff

In theory, I love this concept! In reality, it’s pretty tricky.
What Is A Need?
Needs are things that you can’t survive without, like housing, food, basic clothing, and transportation to work.
What Is A Want?
Wants are anything that is optional in your life and done for the fun of it. This would include entertainment, vacations, gifts, and so on.
What Is Savings and Debt Payoff?
If you’re in debt, extra payments towards payoff would count in this category. Any type of savings also fits here.
Gray Area in the 50/30/20 Rule
While these categories may seem clear, they’re actually so vague that it’s really hard to use. Is my clothing budget a need or a want? Well, obviously, we need to be clothed, but everyone in my house has enough clothing to keep their body covered… so is all the rest a want? What about food? And transportation? Is a new Mercedes a need or a want? It does get you to work!
I tried to categorize my own budget using this rule and it felt a bit impossible because of all the gray area. I do think it’s a good checkpoint for those who want to know if they’re in the ballpark, though. A quick check would be to see if all of your monthly basic obligations add up to less than 50% of your take-home. This would include:
- Rent or mortgage
- Basic utilities (electricity, natural gas, etc)
- Basic food (eating at home only)
- Necessary clothing
- Required transportation expenses
If these things exceed 50% of your take-home income, you’re likely to feel very crunched and unlikely to make much headway on savings or paying off debt.
What About Childcare?
A criticism I’ve often heard of all of these budget category percentages is that they don’t include childcare. For many families, the cost of childcare can match their housing payment. If it’s one of the biggest expenses, why is it not included?
I think there are two reasons why childcare is excluded from these budget recommendations:
- Childcare expenses are large, but they’re only incurred by a small number of families. Only about 18% of US household have children under age 6 and not even all of those would have childcare expenses.
- I think many financial experts consider childcare a cost of working. Since these categories are generally for take-home pay, I think it’s expected that childcare expenses would be subtracted to calculate take-home pay.
For the purposes of examining your budget category percentages, I would subtract childcare expenses from your income before looking at your budget. Alternately, using the 50/30/20 rule, you could include childcare in your 50% needs calculation.
What Do You Do if Your Budget Doesn’t Match the Ideal?
If your budget does not fit these recommended budget percentages, it might be time to examine it. Keep in mind, though, that all budgets are personal. A budget is simply a plan to use your money to reach your own personal goals. No one else can tell you what your goals should be. Assuming you’re unsatisfied with your budget, let’s look at the possible scenerios:
Spending Too Much on Wants
If you’re spending too high of a percentage of your income on wants, you have two options:
- Decrease your spending by reducing shopping, eating out, vacations, and so on.
- Increase your income.
Option 2 doesn’t seem to work well for people who spend too much on wants because their spending will likely continue to increase along with income. Honestly, though, this doesn’t seem to be a very common problem. At least with the people I’ve talked to, the budget issues are rarely about huge spending on wants. Maybe that’s because the people I talk to are the ones who are trying to do better with their finances and they’ve already cut out the excess wants. I’ve heard many people say, “Why does everyone tell me to cut out daily Starbucks? I’m not going to Starbucks everyday!”
Spending Too Much on Needs
Spending too much on needs is the more common problem. How is that possible to overspend on needs? Well, we all need a house and basic transportation, but there’s a HUGE range of costs for those things. The problem is that correcting these kinds of budget problems mean big life changes. You have two options.
- Decrease spending on needs by moving to a less expensive home or getting rid of cars.
- Increase your income.
Option 1 is not always very feasible. If it is possible, it can be a very difficult thing to get the whole family on board. I personally did make these kinds of changes when we first started paying off our debt. We realized that our budget wasn’t working, so we sold both of our expensive cars and replaced them with two clunkers. It made a huge difference in our budget, even if our families thought we had lost our minds!
While option 2 might sound too difficult, the truth is that your income will likely increase over time, especially if you’re still early in your career. If you manage to not increase your standard of living, your budget percentages will gradually improve. This happened to us as my husband got raises and promotions over the years.
If you’d like to increase income faster, you can add more income through extra work.
Savings or Debt Payoff Is Too Low
If you’re not saving enough or paying off your debt quickly enough, you have a few options that we’ve already covered:
- Decrease spending on your wants.
- Decrease spending on your needs.
- Increase your income.
How We Fixed Our Broken Budget
When I first became a stay-at-home mom, our budget was NOT working. Our percentages were way off and something needed to change. Here’s what we did:
- Reduced our food spending by eating out less often, cooking from scratch more, and switching to grocery shopping at Aldi.
- Reduced our car expenses by selling both of our expensive cars, eliminating our car loans, and switching to paid-for clunker cars.
- Increased our debt payoff and savings amounts with the money that was freed up.
- Kept our housing costs steady, even as our income gradually increased. Slowly our house payment became a smaller percentage of our income.
How Does Your Budget Compare?
Are you fitting the ideal budget category percentages? What areas do you need to increase or decrease?